
Election 2016 Forecast / Turnout and Result: Age Cohort Enthusiasm Breakdown
Each candidate appears to be leading within distinct age cohorts. Generally, polls in 2016 tend to show younger age groups leaning Democrat and older age groups leaning Republican. Certainly, this trend is not that new considering the strong youth vote was an important factor in electing Obama. In 2008 and 2012, however, the youth demographic had a significant degree of enthusiasm for the election. In 2016, this enthusiasm seems to have evaporated which does not bode well for Clinton.
Quinnipiac University asked the following question in one of its polls:
“Compared to past presidential elections, how would you describe your level of enthusiasm about voting in this year’s presidential election; are you more enthusiastic than usual, less enthusiastic or about the same as usual?”
The response data is presented by age group, gender, political party and race.
By taking the “More Enthusiastic” percent responses and subtracting the “Less Enthusiastic”, we can calculate a net enthusiasm rating by age group. Then, by taking the percent voters inclined to vote for Clinton and subtracting those for Trump, we can calculate a net voter intention rating. The following chart compares these two net ratings.
Chart 1: Quinnipiac Poll Data, Net Voter Intention versus Net Enthusiasm Rating by Age Group
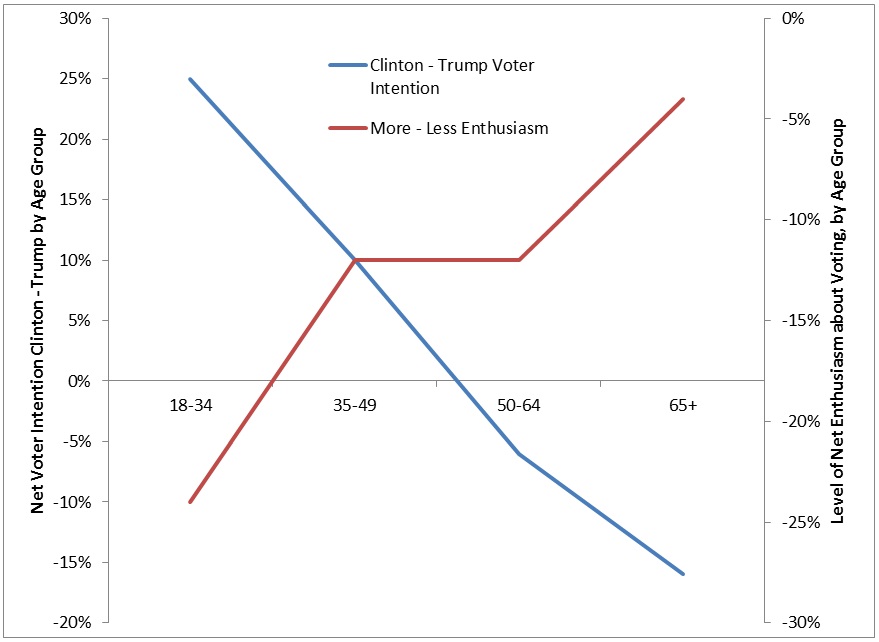
Source: Quinnipiac University Poll
The previous chart shows that there appears to be an inverse relationship between net intention to vote for Clinton and net enthusiasm to vote. In other words, the youngest age group is the most likely to vote for Clinton but the least likely to actually vote due to low enthusiasm. Conversely, the oldest age group is the most likely to vote for Trump and the most likely to vote due to relatively higher net enthusiasm levels.
The same Quinnipiac Poll shows enthusiasm by political party. There were 38% of Republicans who rated themselves as More Enthusiastic in comparison to 28% for Democrats. It looks like this confirms other enthusiasm polls such as the CNN poll which shows the enthusiasm advantage going to the Republicans.
Perhaps more surprising, there is little difference between enthusiasm levels by gender. In fact, they are almost exactly the same with men having a slight advantage over women. For men, 29% answered More Enthusiastic versus 27% for women. This is very surprising as Clinton is the first female presidential candidate (from a major party) but she is not generating significant enthusiasm from female voters.
Race breakdown shows a similarly negative situation for Democrats. The most loyal voting demographic for the Democrats has been African-Americans. For the Republicans, especially more recently, Whites tend to vote for Republicans at a higher rate. This poll shows that Whites have a 29% More Enthusiastic rating against 20% for African-Americans. This difference implies that it might be difficult to replicate the very high voter turnout that we saw in 2008 and 2012 within the African-American community that help the Democrats so much.
Demographic voting groups which traditionally vote disproportionately for Democrats are lagging in enthusiasm this election. Three of the key demographics (youth, African-Americans, and women) of the Obama ‘Coalition’ that helped in his election are considerably lacking in terms of enthusiasm in 2016. If we assume that enthusiasm levels generally are tied to voter turnout, then these polls are a negative sign for Clinton.
Again, as current poll models are based off of the most recent elections to re-weight responses, any significant change in turnout will throw poll results off significantly. Not to sound like a broken record, but shifting voter turnout will likely be one of the most important elements of this election and is extremely under studied and under reported.